Is that a Bullish Gartley Pattern on FTM/USDT??

I may send some Premium Signals for this one. consider adding it to your coin list if you wanted to speculate on this beauty.
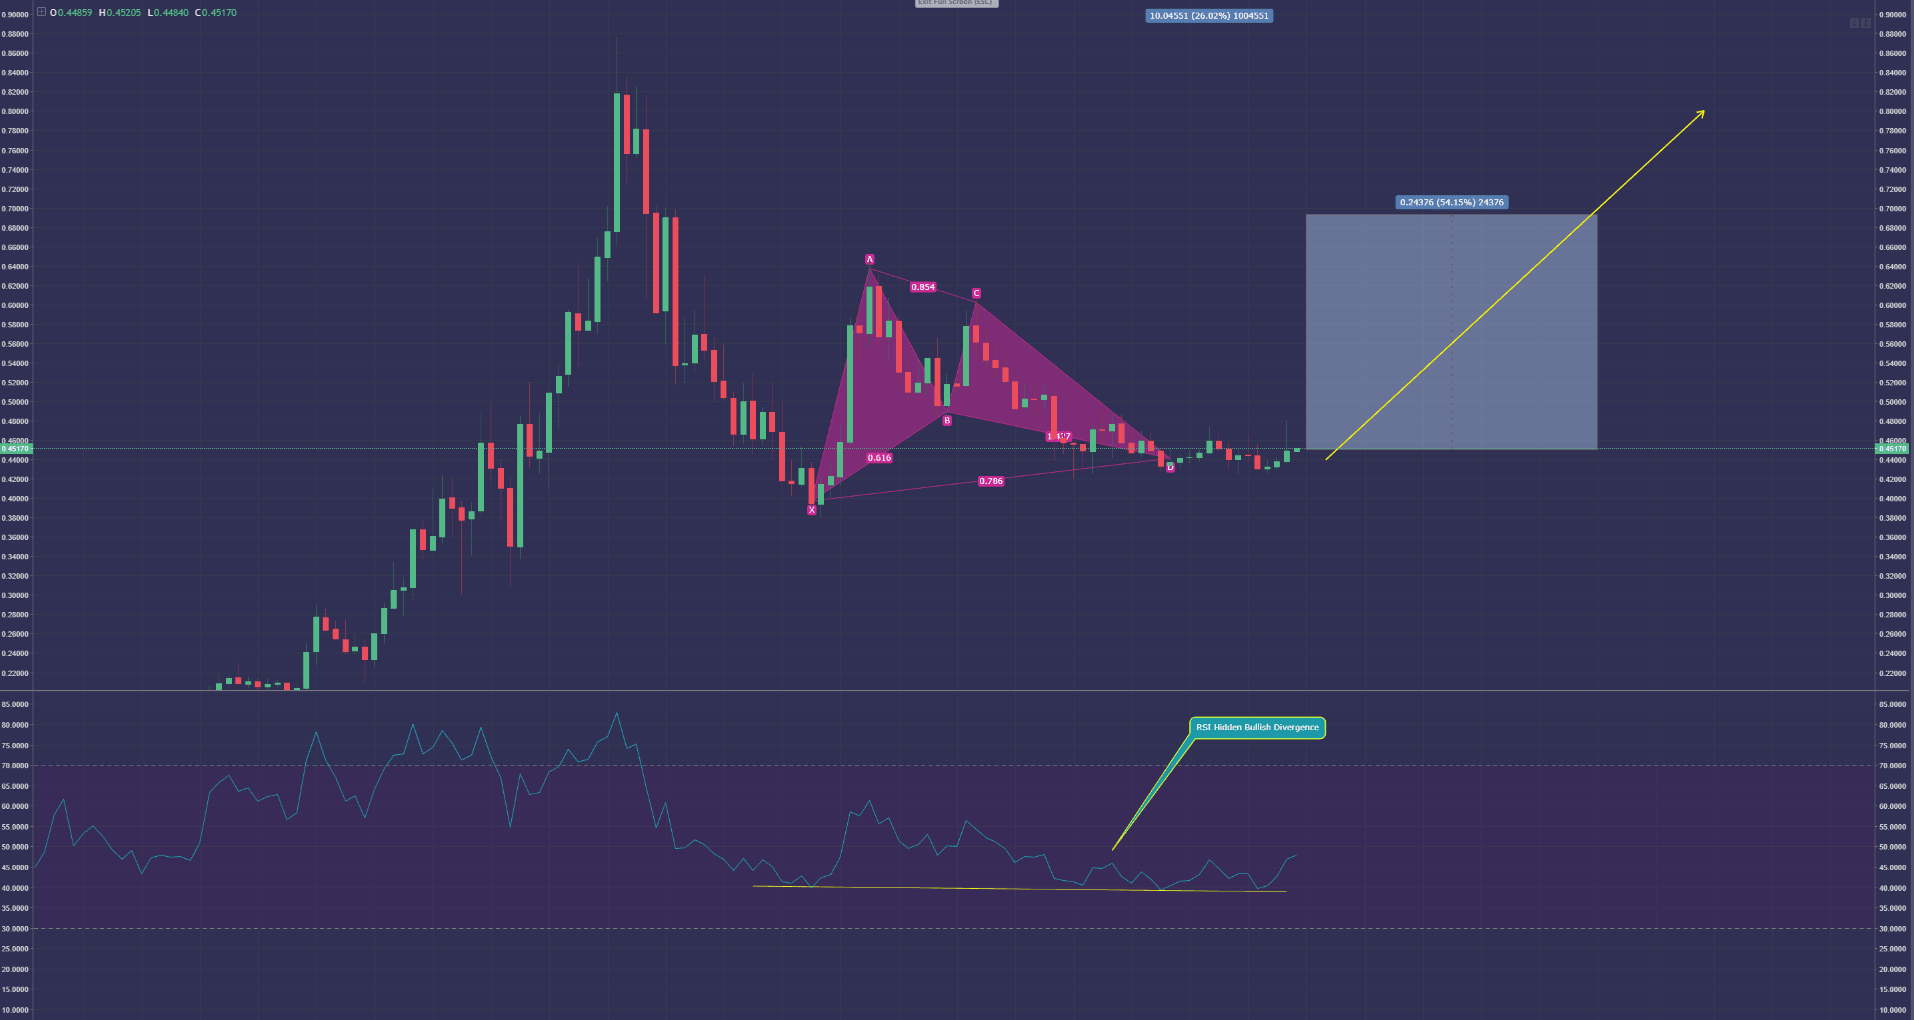
This FTM/USDT Chart is looking incredible!
This is exactly the kinds of metrics Killer Whale looks for when doing TA. We have a wonderful Bullish Gartley Harmonic Pattern at the Pattern Completion Zone (PCZ). BTC is attempting to Breakout as I write this article, there is RSI Hidden Bullish Divergence on the 4hr Chart as well as the Daily RSI is in Neutral/Bullish territory. Not to mention the Price Action has been Consolidating since February 24th.

Trade Idea:
Entry into FTM/USDT between $0.41-$0.49
Traditional Target Range between $0.53-$0.69
Non Traditional Target is all the way above 300% from time of writing, FTM/USDT is at $0.45458. Be Safe do not get greedy here friends. Save a Position in reserve if you want to shoot for non traditional targets. Get in and get out. Don't Date It, Don't Hate It, Just Trade It!
Just wanted to put this on everyone's radar!
Be Smart, and as Always Stay Strong Friend!!
Killer Whale Crypto
Most Recent

Killer Whale Portfolio Management Service
Ashley E. Shiver - Apr 9, 2024

Redefine Wealth: Exploring Crypto's New Frontier in Generating Profit
Ashley E. Shiver - Apr 8, 2024

Cryptocurrency: The Unsung Hero of Global Unity
Ashley E. Shiver - Feb 29, 2024

The Epic Saga of Blockchain Evolution
Ashley E. Shiver - Feb 27, 2024

Smart Contracts: Automating the Future
Ashley E. Shiver - Feb 26, 2024

7 Reasons Crypto is Skyrocketing in 2024
Ashley E. Shiver - Feb 25, 2024
Stay Up To Date
Get weekly insights and updates from the Killer Whale Crew
Categories
Start Trading
Large Cap
strategy
Trade Duration
Trade Frequency
Gain ETH
strategy
Trade Duration
Trade Frequency
Gain BTC
strategy
Trade Duration
Trade Frequency
Pro
strategy
Trade Duration
Trade Frequency