Give Me this Day My Daily Gain Bitcoin

April Showers will Bring May Flowers! History begins again in Q2 2021
If you thought Q1 2021 was explosive... Just wait what the future will hold. My friends I am glad to have every one of you here for the journey of a lifetime. Just the past week in Crypto is enough to get you hooked for life. All hype aside we must remain vigilant and consider what has already happened in 2021. This article will be a review of the price action on Bitcoin since the beginning of the year 2021.
Bitcoin/USDT:
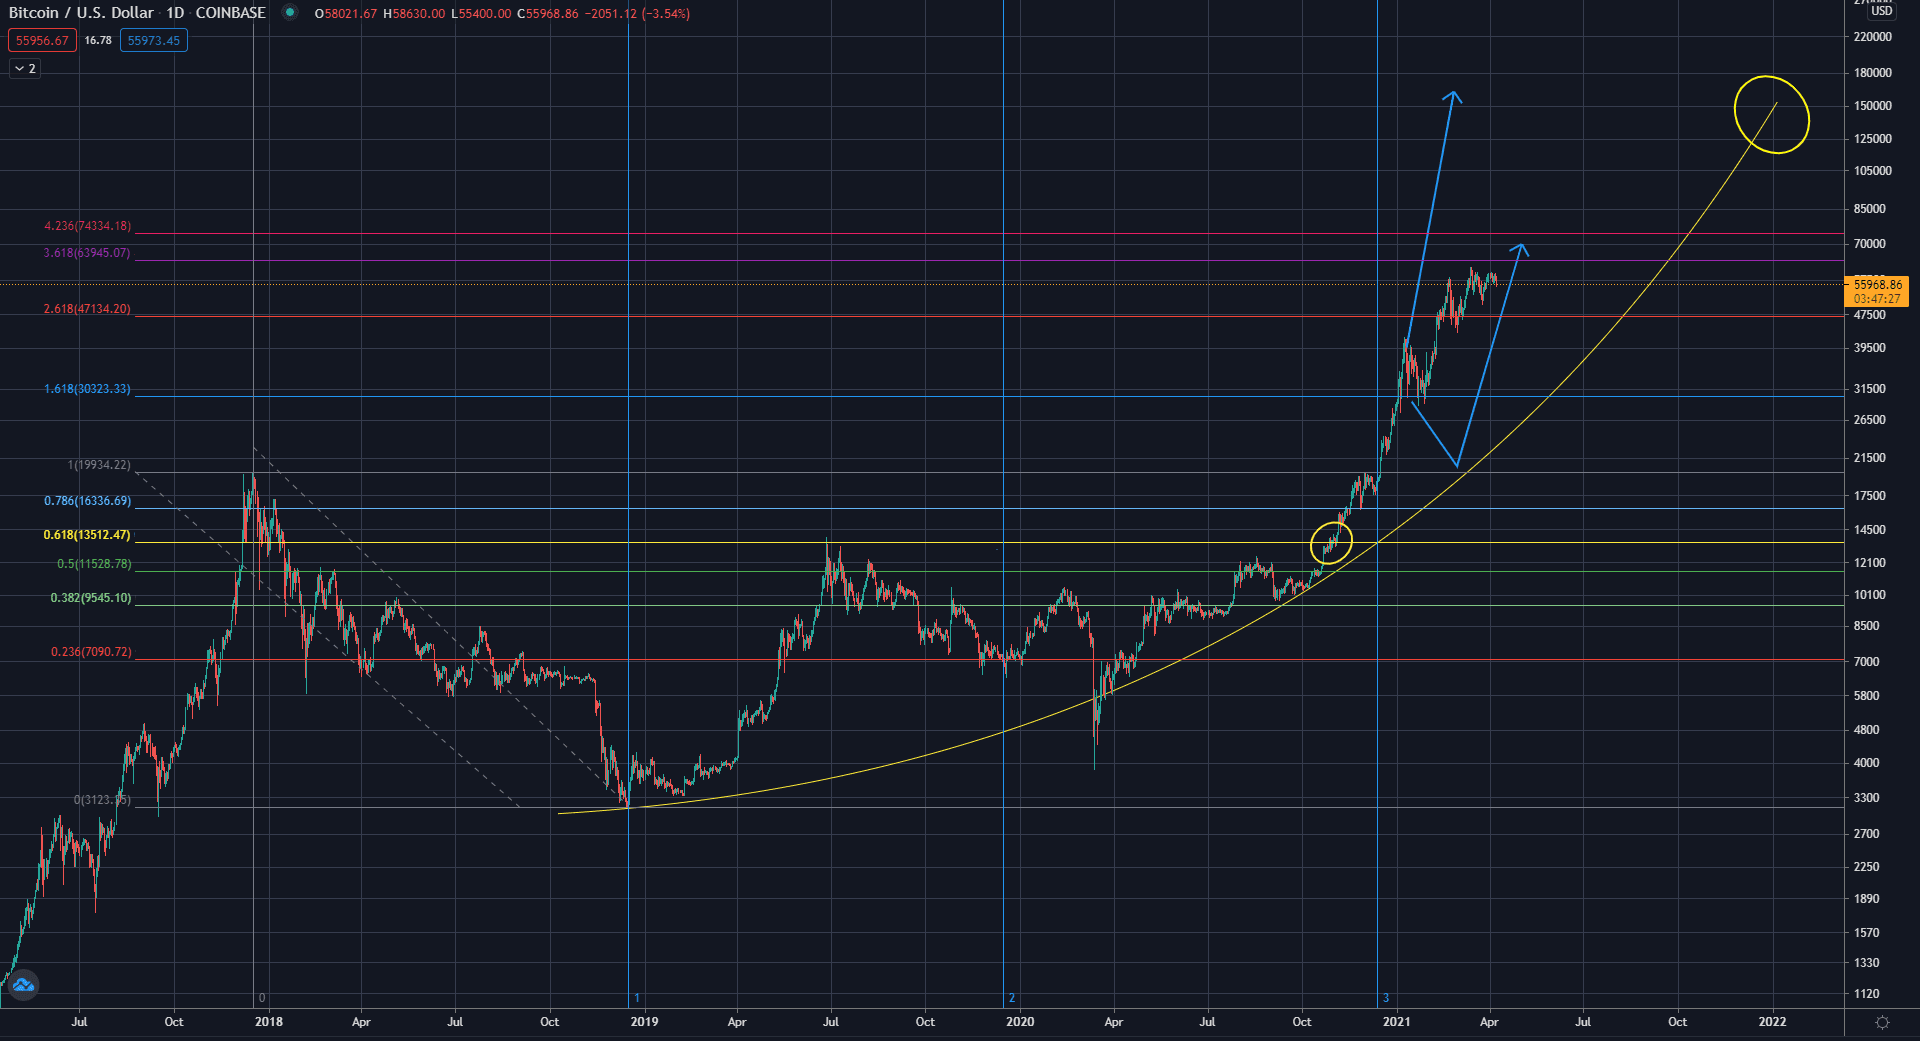
There are so many things goin on in this chart, the image below is BTC/USDT on the Daily Timescale from the beginning of the year. What a ride it has been for the past 96 days, taking the price of Bitcoin from an already historic level of $28,000 all the way up to $62,000 or a whopping 220%. By traditional standards I would call this a home run!!
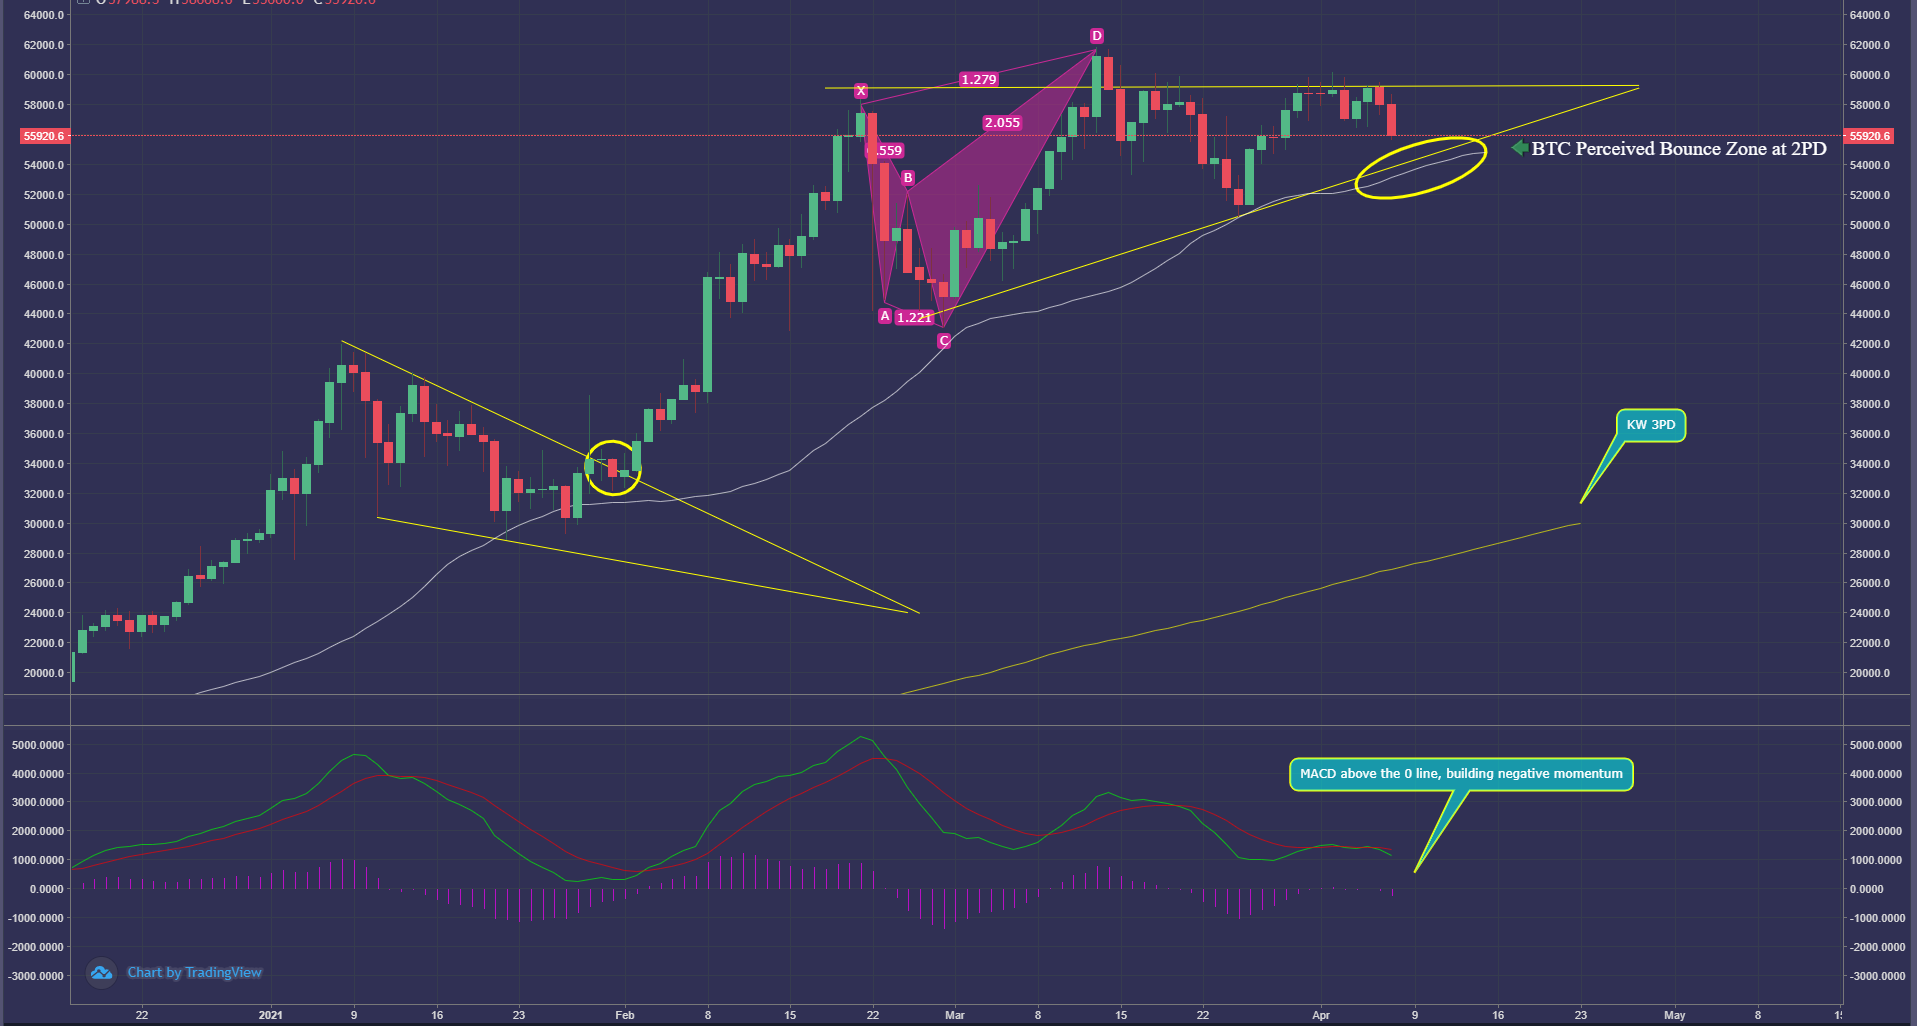
The gold line at the bottom of this image is the Killer Whale 3rd Point of Demand (3PD). This line represents the most likely place Buy Orders are most likely to be on a given timescale. The white line in the image closest to the price action is the Killer Whale 2nd Point of Demand. You will notice every time the price action in this trend approaches the 2nd Point of Demand (2PD) on the Daily Timescale, the amount of buying pressure is immense that sellers lose all ground almost immediately. The price action being so far above the 3PD means that even if the price of Bitcoin dropped to between $30-35K this bullish trend would remain fully intact, as terrifying as it would be.
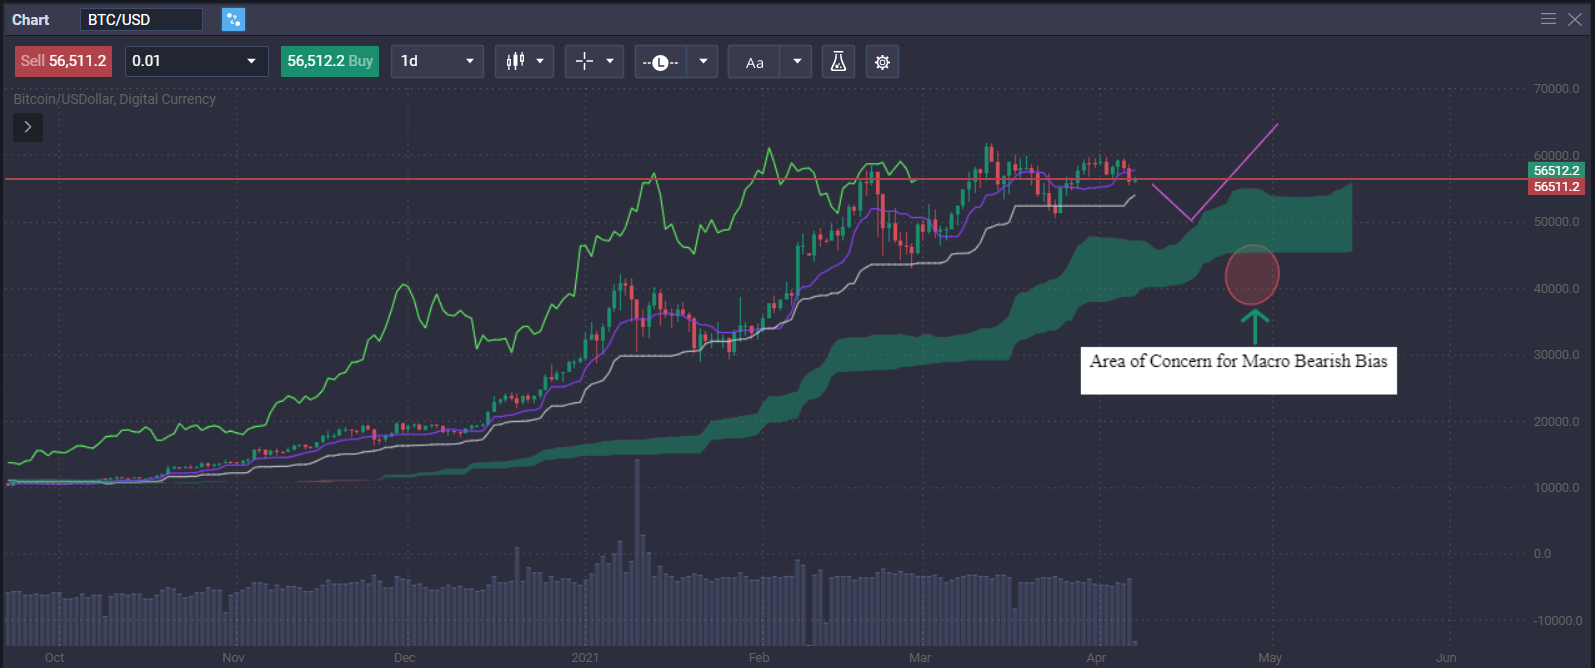
The chart below is using the Ichimoku Indicator which I don't talk about nearly as often as it deserves.
What is the Ichimoku Cloud Indicator?
The Ichimoku Cloud Indicator is a collection of technical indicators that show support and resistance levels, as well as momentum and trend direction. It does this by taking multiple averages and plotting them on the chart. It also uses these figures to compute a "cloud" which attempts to forecast where the price may find support or resistance in the future. It provides more data points than the standard candlestick chart. While it seems complicated at first glance, those familiar with how to read the charts often find it easy to understand with well-defined trading signals.
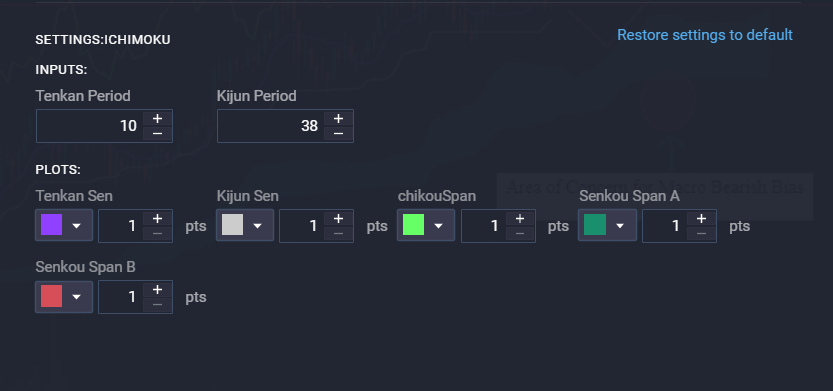
Let me show you the KW metrics I use so we can all be on the same page, I encourage you to throw this on a chart and save it for the future:
The signs of bearish bias beginning to take hold would come in the form of of the 1 Day Timescale having a concrete break of the 4hr Timescale's respective 3rd Point of Demand. I have highlighted the exact area for BTC that could cause trouble for the Macro Trend of crypto markets using the Ichimoku Indicator.... Now let me tell you why I think there is very small probability of this outcome coming to fruition.
One characteristic of the Ichimoku Indicator is the Ichimoku Cloud, a general rule of thumb is when the Ichimoku Cloud is widening the action of the Trend is becoming stronger and stronger. What you will notice in this chart is the Ichimoku Cloud sitting at its widest point in the entire trend. This is a double edge sword because when the cloud is as extensively wide as it is now, there can often be extended amounts of consolidative price action. I have highlighted how this phase of corrective action could take us a bit longer, continuing until the beginning of May with the purple line bouncing off of the top of the Ichimoku Cloud. You will also notice how the price action has never come to test the top of the Ichimoku Cloud.... Interesting.
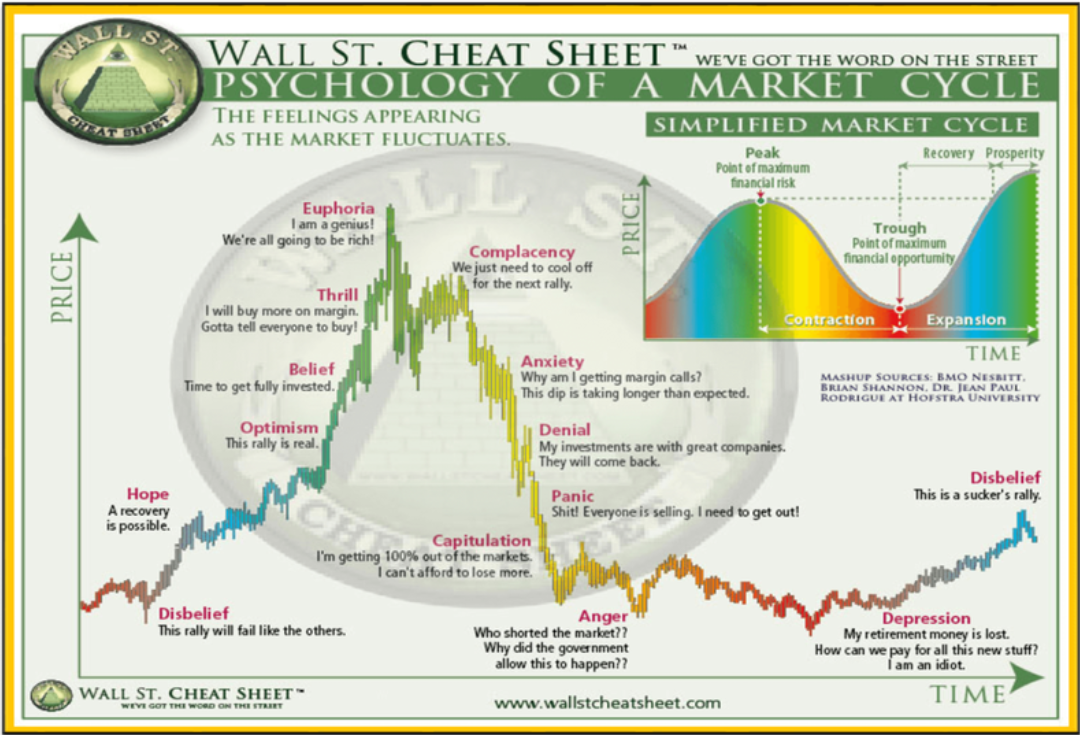
Wall Street Cheat Sheet
If we distill the Wall Street Cheat Sheet down to its basic message, what it aims to show is the emotions that propel huge, volatile movements in markets, the aforementioned fear and greed.
To be more specific, the emotions depicted on the Wall Street Cheat Sheet are those of the “dumb money”, the mostly un-profitable participants in this particular market pattern. After all, we can presume that both successful and unsuccessful traders/investors experience fear and greed on some level. Critically, they do not occur at the same time; and nor should winning traders be overcome by emotions. Here is where I aim to aid in the process of flipping your mentality about trading by recognizing and defining where we are in a cycle and how to keep the gains we make in the long haul. Countless trading opportunities have been ushered in thanks to the price action of Bitcoin. Now my friends, we are in the midst of witnessing a critical moment in the mentality of our fellow traders.
The resistance level of $60K is extremely psychological, I believe it marks the beginning of the Optimism Phase of this current cycle according to the Wall Street Cheat Sheet.
This part of the cycle can be the most rewarding or the most dangerous. Making gains is one thing, keeping and realizing them is a completely different ball game. Stay Strong Friends!!
Killer Whale Crypto
Most Recent

7 Ways Business Owners Can Utilize Cryptocurrency to Enhance Operations
Ashley E. Shiver - Apr 24, 2024

Embracing the Future: Algorithm Intelligence
Ashley E. Shiver - Apr 24, 2024

Enterprise Solutions
Ashley E. Shiver - Apr 9, 2024

Killer Whale Portfolio Management Service
Ashley E. Shiver - Apr 9, 2024

Redefine Wealth: Exploring Crypto's New Frontier in Generating Profit
Ashley E. Shiver - Apr 8, 2024

Cryptocurrency: The Unsung Hero of Global Unity
Ashley E. Shiver - Feb 29, 2024
Stay Up To Date
Get weekly insights and updates from the Killer Whale Crew
Categories
Start Trading
Large Cap
strategy
Trade Duration
Trade Frequency
Gain ETH
strategy
Trade Duration
Trade Frequency
Gain BTC
strategy
Trade Duration
Trade Frequency
Pro
strategy
Trade Duration
Trade Frequency