Ethereum Comparison to Bitcoin ETH/BTC

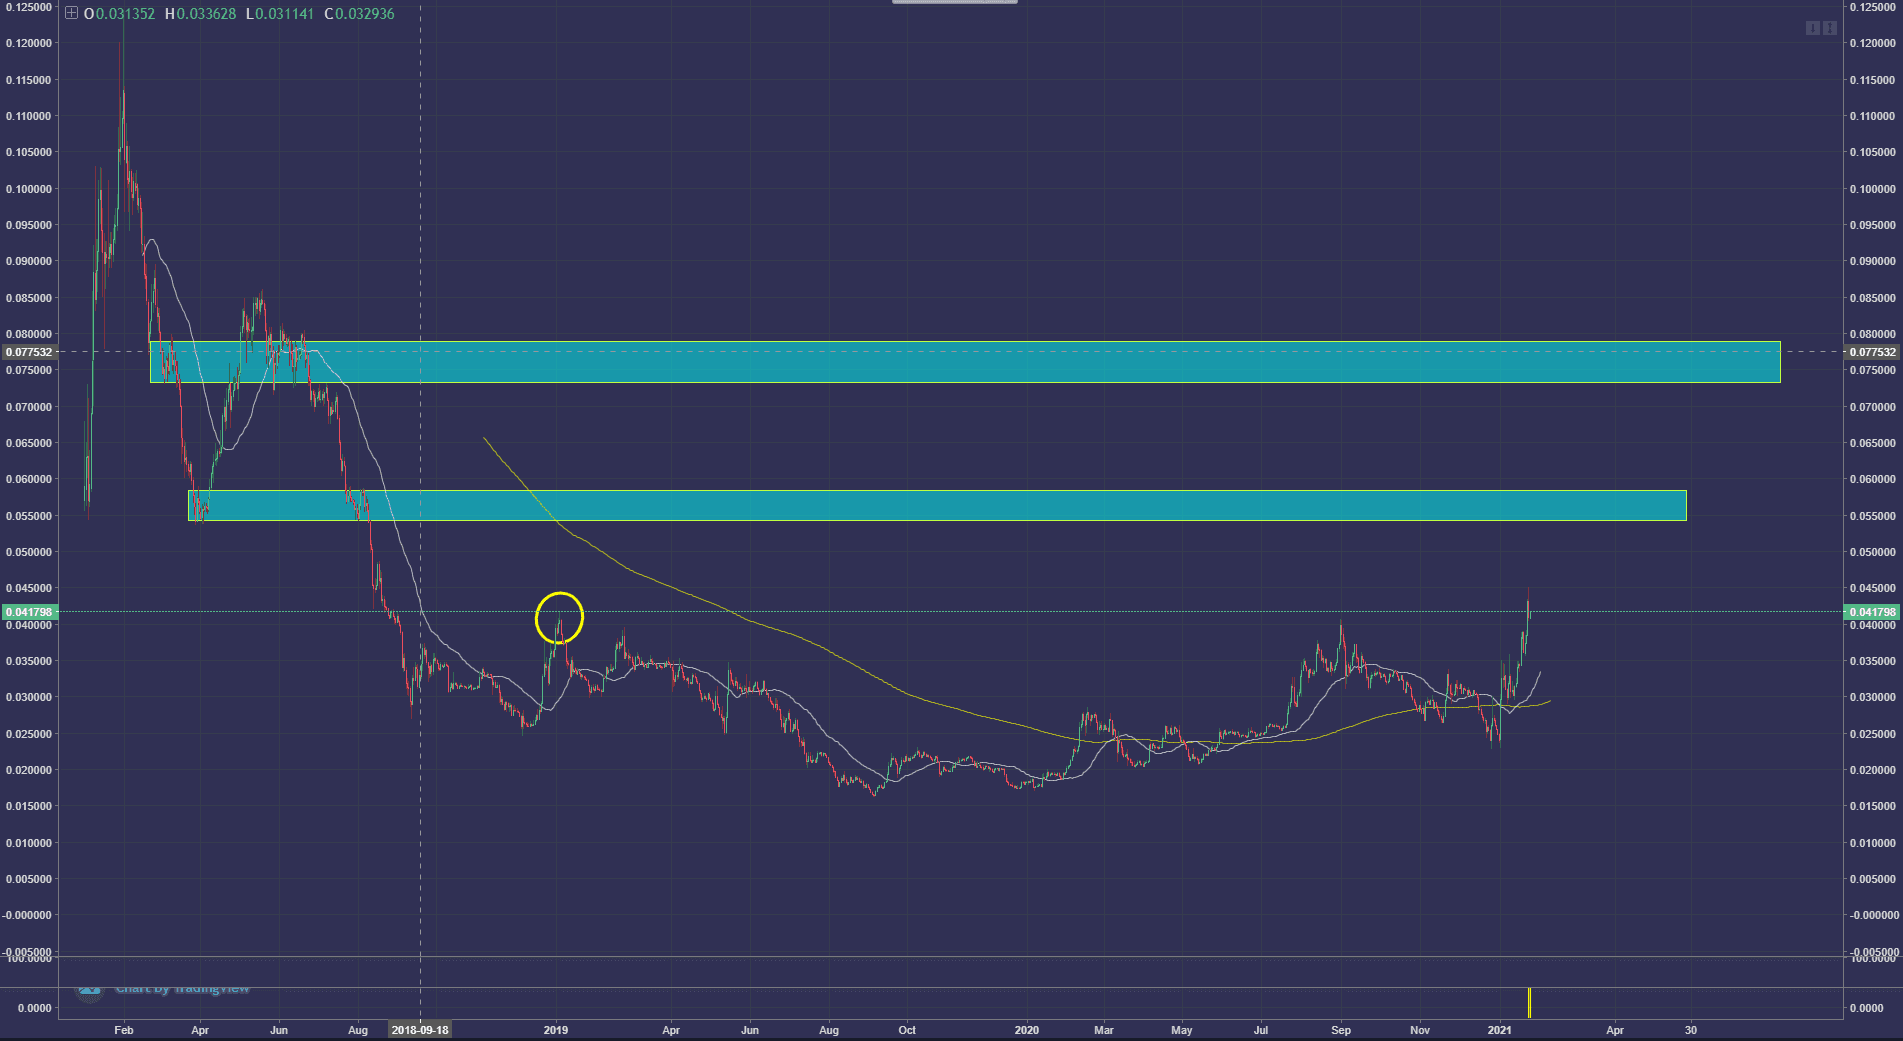
ETH is attempting to break a resistance level from January 2019. This is an extremely promising sign that Ethereum will begin to out-perform Bitcoin
The Chart below is BTC/ETH on the 1 day timescale. What you will notice is Ethereum firmly breaking through the Third Point of Supply/Demand (Yellow Line). Notice the bubble on the left as ETH is attempting to break a resistance level from January 2019. This is an extremely promising sign that Ethereum will begin to out-perform Bitcoin in the coming months. There could be a slight decoupling of the two assets in the short to mid term if Bitcoin continues in a sideways trajectory. There are 2 levels of resistance currently above at 0.055BTC and 0.08BTC.

The Chart Below is BTC/USDT on the 4hr timescale. There is a Descending Wedge formation Bitcoin. In addition to that there is a down trending level of resistance on the RSI that is attempting to be broken. This is not a strong confirmation but signifies that the Relative strength of the short term trend could begin to trend above 50 in the near future. Yet again the MACD is also showing signs of the short and mid term battle to regain the 0 line. If divergences begin to form on the higher timescales we could start to say there is an edge for a trend continuation.

Quick update from the Killer Whale. Be vigilant, keep safe and stay strong friends!
Most Recent

Killer Whale Portfolio Management Service
Ashley E. Shiver - Apr 9, 2024

Redefine Wealth: Exploring Crypto's New Frontier in Generating Profit
Ashley E. Shiver - Apr 8, 2024

Cryptocurrency: The Unsung Hero of Global Unity
Ashley E. Shiver - Feb 29, 2024

The Epic Saga of Blockchain Evolution
Ashley E. Shiver - Feb 27, 2024

Smart Contracts: Automating the Future
Ashley E. Shiver - Feb 26, 2024

7 Reasons Crypto is Skyrocketing in 2024
Ashley E. Shiver - Feb 25, 2024
Stay Up To Date
Get weekly insights and updates from the Killer Whale Crew
Categories
Start Trading
Large Cap
strategy
Trade Duration
Trade Frequency
Gain ETH
strategy
Trade Duration
Trade Frequency
Gain BTC
strategy
Trade Duration
Trade Frequency
Pro
strategy
Trade Duration
Trade Frequency